


TL;DR:
- Marketing data analysis involves interpreting marketing metrics to connect actions directly to revenue outcomes. Effective analysis starts with a clear business question, employs segmentation, and integrates multiple data sources for accurate ROI measurement. Continuous data quality practices and automation help identify performance issues early, enabling better strategic decisions.
Marketing data analysis is the systematic process of interrogating and interpreting marketing metrics to drive strategic business decisions. Most teams collect plenty of data but stop at surface-level reporting. The gap between a dashboard full of numbers and a decision that moves revenue is where real analysis lives. Tools like Google Analytics, Salesforce CRM, and HubSpot generate enormous data volumes. The challenge is turning that raw output into insight that connects directly to KPIs, customer acquisition cost, and lifetime value.
What are the essential steps to analyze marketing data effectively?
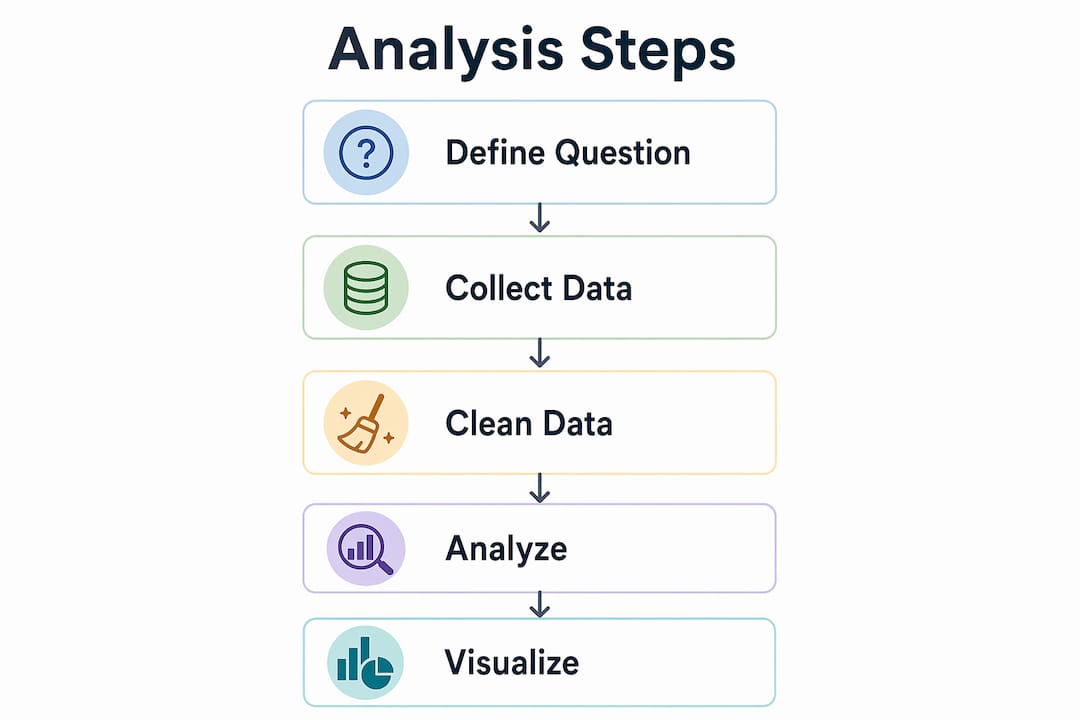
The first step is defining a clear, revenue-linked business question before touching any data. Question-first analysis keeps teams focused on channels producing leads that exceed revenue thresholds, rather than chasing anonymous traffic spikes. A question like “Which paid channels drive leads with a CAC below $150?” is far more useful than “How is our traffic performing?”

Once your question is set, data collection and cleaning follow. Inconsistent UTM parameters, duplicate contact records, and broken tracking pixels are the most common culprits that corrupt analysis before it starts. Standardize naming conventions across Google Ads, Meta, and your CRM before pulling any report.
Analytics itself operates at three levels. Descriptive analytics tells you what happened. Diagnostic analytics isolates root causes, such as identifying whether a 25% spike in Cost Per Acquisition came from creative fatigue or a new competitor entering the auction. Predictive analytics projects what is likely to happen next based on historical patterns.
| Step | Output |
|---|---|
| Define business question | Focused, revenue-linked hypothesis |
| Collect and clean data | Standardized, trustworthy dataset |
| Descriptive analysis | Summary of what happened |
| Diagnostic analysis | Root cause of performance changes |
| Predictive analysis | Forecast of future outcomes |
| Visualize and communicate | Stakeholder-ready findings |
Pro Tip: Avoid building reports around metrics that feel impressive but do not connect to revenue. Pageviews and follower counts are context, not conclusions.
Visualization is the final step most analysts rush. Match the format to the audience. A CFO needs a revenue attribution summary. A media buyer needs a channel-level breakdown by device and time period. Google Looker Studio and Tableau both support role-specific dashboard views that serve both audiences without a single bloated spreadsheet.
Which marketing data analysis techniques deliver the best insights?
Segment-level analysis is the most underused technique in most marketing teams. Breaking CAC or LTV across two dimensions, such as audience segment and geography over time, reveals high-value cohorts that blended averages hide completely. A campaign that looks average overall may be exceptional in one region and failing in another.
Multi-touch attribution, marketing mix modeling, and incrementality testing each answer a different question. Multi-touch attribution shows which touchpoints contributed to a conversion. Marketing mix modeling quantifies the revenue impact of each channel at scale. Incrementality testing measures what would have happened without a specific campaign. Integrating all three under an AI-driven framework delivers the most complete picture of budget efficiency.
Comparing core analysis techniques
| Technique | Best use case | Key limitation |
|---|---|---|
| Multi-touch attribution | Mapping conversion paths | Struggles with offline and view-through |
| Marketing mix modeling | Cross-channel budget allocation | Requires significant historical data |
| Incrementality testing | Measuring true campaign lift | Resource-intensive to run at scale |
| Segment-level analysis | Identifying high-yield cohorts | Needs clean, consistent data taxonomy |
| Predictive modeling | Forecasting campaign performance | Accuracy depends on data volume |
AI-driven prescriptive analytics go further than prediction. These systems recommend specific budget reallocations or creative changes and present them in plain language that does not require a data science background to act on. Platforms like Google’s Performance Max and Meta’s Advantage+ already embed prescriptive logic into their bidding systems.
Pro Tip: Set up automated anomaly detection in Google Analytics 4 or your BI tool of choice. When a metric deviates more than 15% from its 30-day average, you want an alert before the budget runs out, not after.
Relying on a single data source is the most common structural mistake in marketing analysis. Google Analytics alone cannot tell you whether a lead converted to revenue. Your CRM cannot tell you which ad creative drove the lead. The insight lives at the intersection of both systems. For a deeper look at how analytics drives digital growth, the connection between data sources and business outcomes becomes clear quickly.
How can marketers interpret and leverage data to improve performance?
Interpreting marketing data means separating signal from noise. Day-to-day fluctuations in click-through rate or cost-per-click are rarely meaningful on their own. Compare performance against the same period in the prior year, the prior quarter, and the prior 30 days before drawing any conclusion. A single week of low conversions during a holiday period is noise. A four-week decline following a creative refresh is a signal.
True marketing ROI requires joining marketing spend data with CRM and revenue records. Clicks and impressions without linkage to closed revenue tell you almost nothing about whether a campaign is working. This connection is what separates a reporting function from a genuine analysis function.
Breaking KPIs into segments reveals where to act. If your overall conversion rate is 2.3%, that number is nearly useless for decision-making. Break it by device, funnel stage, audience cohort, and traffic source. You may find mobile converts at 1.1% while desktop converts at 4.2%. That gap is a budget reallocation decision waiting to happen. For practical frameworks on measuring marketing ROI by segment, the diagnostic approach pays off fastest.
Common pitfalls in data interpretation include:
- Blended averages hiding underperformers. Always segment before concluding.
- Correlation treated as causation. A traffic spike during a PR mention does not prove the PR drove conversions.
- Recency bias. Last week’s data feels more important than it is. Weight trends over time.
- Ignoring statistical significance. A 10-conversion sample is not enough to declare a winner in an A/B test.
- Stakeholder-driven conclusions. Letting a preferred outcome shape the analysis produces misleading recommendations.
Pro Tip: When presenting findings to leadership, lead with the revenue impact first. “This channel shift could reduce CAC by $40” lands harder than any chart.
What are common challenges in marketing data analysis?
Data silos are the single biggest obstacle most marketing teams face. When paid media data lives in Google Ads, email data lives in Mailchimp, and CRM data lives in Salesforce, no one has a complete view of the customer journey. Each platform reports its own conversions, which leads to double-counting and inflated ROI figures.
Inconsistent naming conventions compound the problem. If one team tags campaigns as “Brand_Search_US” and another uses “brand-search-us,” your aggregated reports will split what should be a single data series into two. This is not a technology problem. It is a process problem that requires a shared naming standard enforced before campaigns launch.
Automated alerts for budget pacing and performance deviations are a practical safeguard against errors that manual spreadsheet workflows miss entirely. When a campaign’s cost-per-lead doubles overnight, an automated alert catches it in hours. A weekly manual review catches it after the damage is done.
Here is a numbered troubleshooting checklist for common data quality issues:
- Audit UTM parameters across all active campaigns and standardize the taxonomy.
- Check for duplicate contact records in your CRM and merge or suppress them.
- Verify that conversion tracking fires correctly in Google Tag Manager using the preview mode.
- Cross-reference platform-reported conversions against CRM-recorded leads to identify double-counting.
- Set automated anomaly alerts in your BI tool for any KPI that deviates more than 15% from its rolling average.
- Schedule a monthly data quality review with both the marketing and analytics teams present.
Organizational challenges matter as much as technical ones. Marketing, sales, and data teams often work from different definitions of the same metric. “A qualified lead” means something different to a media buyer than it does to a sales rep. Aligning on shared definitions before building reports prevents the most common source of stakeholder disagreement in data reviews. The AI workflow capabilities emerging in 2026 are beginning to automate parts of this alignment process by standardizing metric definitions across platforms.
Key takeaways
Effective marketing data analysis connects every metric back to a revenue-linked question, uses segmentation to expose what blended averages hide, and integrates multiple data sources to measure true ROI.
| Point | Details |
|---|---|
| Start with a business question | Define a revenue-linked hypothesis before pulling any data to stay focused. |
| Segment every KPI | Break CAC, LTV, and conversion rate by audience, device, and geography to find real patterns. |
| Integrate data sources | Join marketing spend with CRM and revenue data to calculate actual ROI. |
| Use diagnostic analytics | Identify root causes of performance changes rather than describing what happened. |
| Automate anomaly detection | Set alerts for metric deviations to catch campaign issues before budgets are wasted. |
What I’ve learned from years of marketing data work
The most common mistake I see is treating data analysis as a reporting task rather than a questioning task. Teams spend hours building dashboards and almost no time deciding what question the dashboard should answer. A beautiful report that tracks the wrong metric is worse than no report at all. It creates false confidence.
The shift toward AI in digital marketing is real, and prescriptive analytics genuinely changes what a small team can accomplish. But AI recommendations are only as good as the data fed into them. Garbage in, garbage out still applies. The teams getting the most value from AI-driven tools in 2026 are the ones that invested in clean data infrastructure first.
My strongest recommendation is to stop analyzing marketing in isolation. The most valuable analysis I have ever seen came from sitting a media buyer, a sales rep, and a data analyst in the same room with the same dataset. The sales rep knew which lead sources closed fastest. The media buyer knew which creatives drove those leads. The analyst connected both to revenue. None of them had the full picture alone.
Focus on revenue-linked questions. Segment relentlessly. Automate the routine checks. And treat data quality as a continuous practice, not a one-time cleanup project.
How Webspidersolutions can support your marketing analysis
Webspidersolutions works with marketing teams that need more than a dashboard. From SEO campaign management to PPC strategy and full-funnel analytics, the team helps businesses connect their data to decisions that drive measurable growth. If your current analysis process stops at reporting and never reaches the diagnostic or prescriptive level, that is exactly the gap Webspidersolutions is built to close. Explore the SEO strategy guide to see how structured data thinking applies directly to organic search performance and campaign planning.
FAQ
What is marketing data analysis?
Marketing data analysis is the process of collecting, cleaning, and interpreting marketing metrics to answer specific business questions and guide strategic decisions. It goes beyond reporting by identifying root causes and recommending actions tied to revenue outcomes.
What tools are used to analyze marketing data?
Google Analytics 4, Salesforce CRM, HubSpot, Tableau, and Google Looker Studio are the most widely used marketing data analytics tools. Each serves a different layer of the analysis stack, from raw data collection to visualization.
How do you interpret marketing data without misleading yourself?
Segment every KPI before drawing conclusions, compare performance across multiple time windows, and always connect metrics to revenue events rather than surface-level engagement numbers.
What is the difference between descriptive and diagnostic analytics?
Descriptive analytics summarizes what happened in a given period. Diagnostic analytics isolates why it happened, such as identifying whether a CPA spike came from creative fatigue or competitive pressure.
How does segmentation improve marketing data analysis?
Segment-level analysis reduces noise by breaking KPIs across two or more dimensions, such as audience and geography, revealing high-value cohorts that blended averages obscure entirely.