
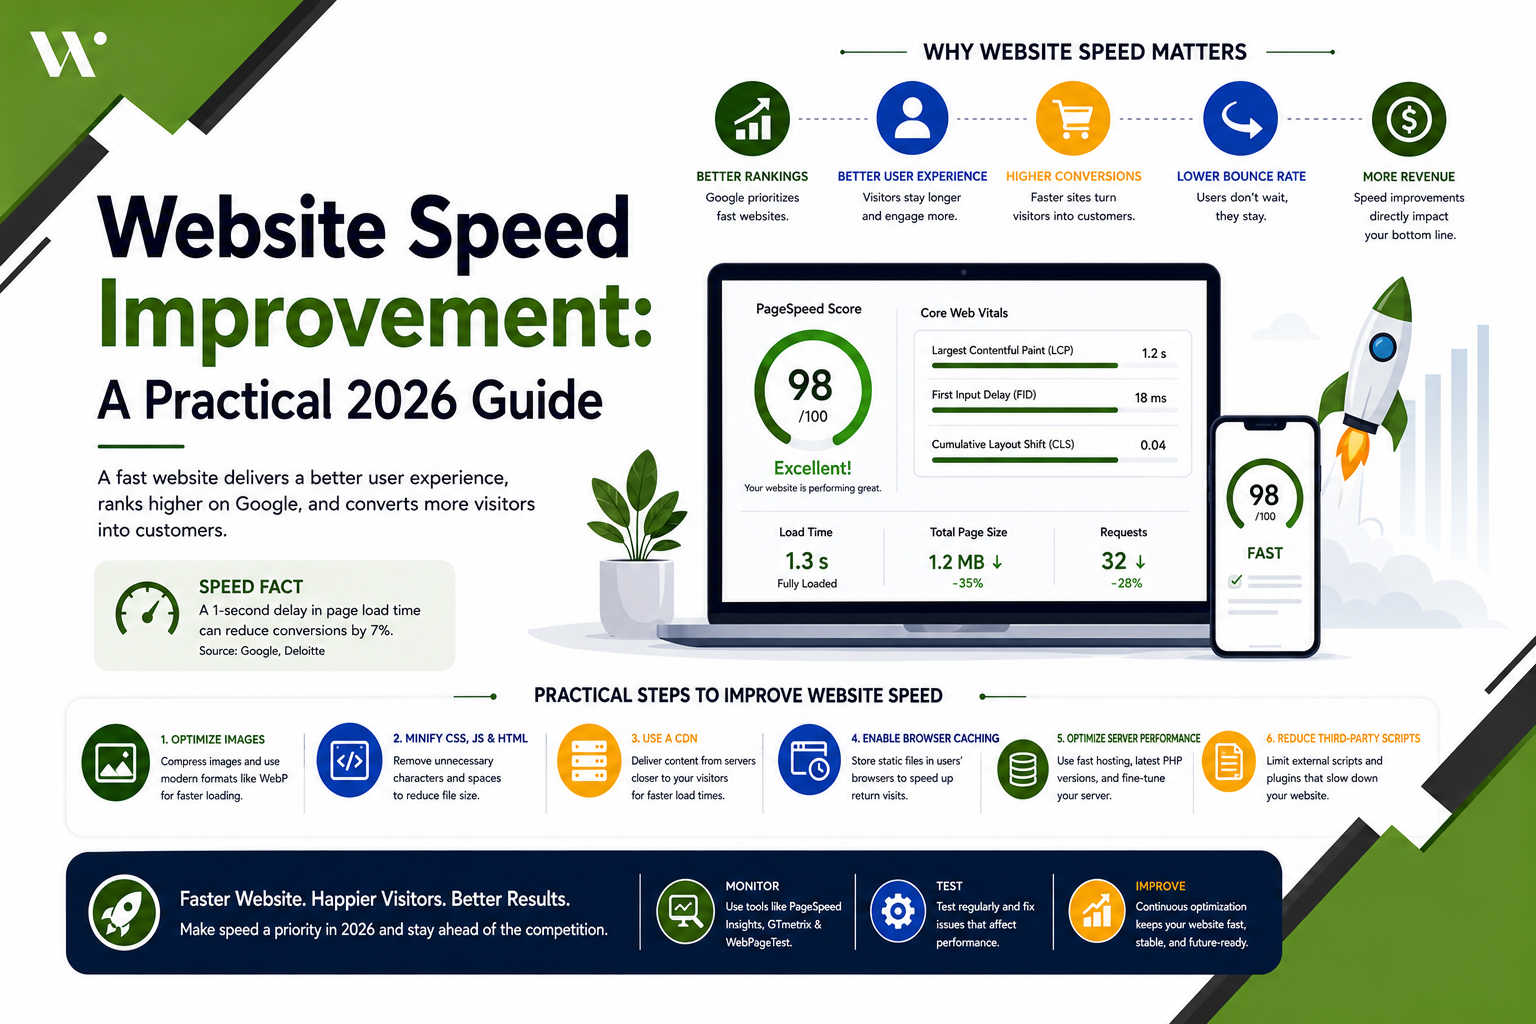






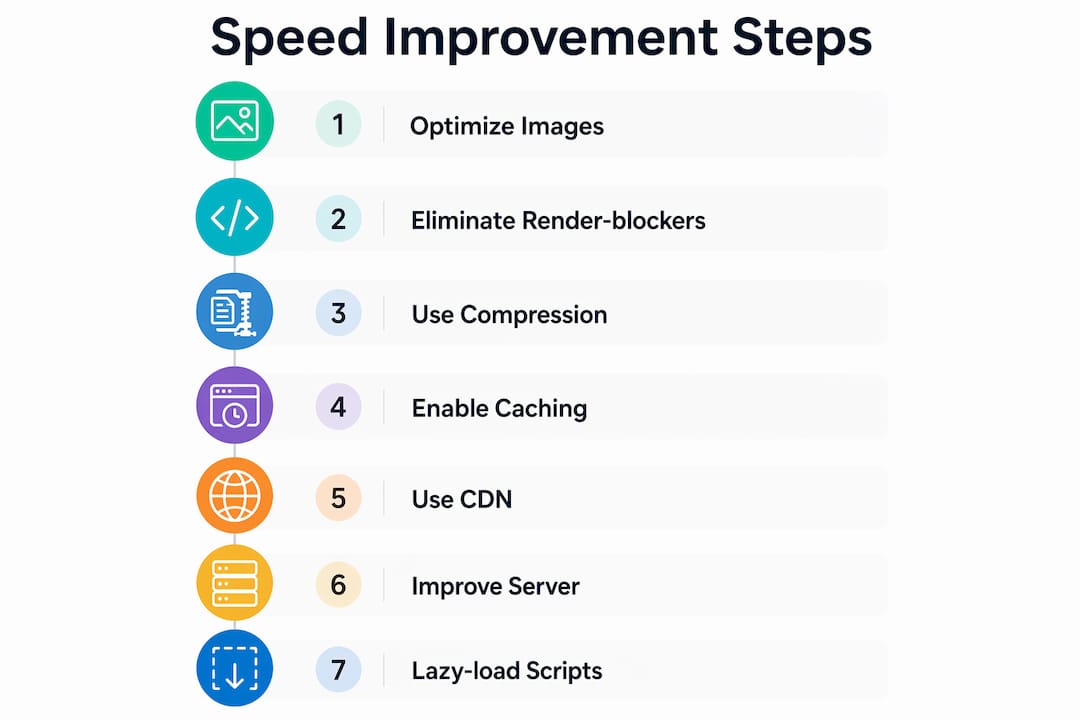
Fast websites convert better, rank higher, and keep visitors from leaving. The most effective website speed improvement strategy follows a clear priority order: fix images first (they typically account for 50–80% of page weight), then tackle JavaScript and CSS, then address server response and caching. You do not need to overhaul everything at once.
Here is what that looks like in practice:
- Images first: Convert to WebP or AVIF, serve responsive sizes with
srcset, and lazy-load everything below the fold. - Code efficiency: Minify CSS and JavaScript, defer non-critical scripts, and strip unused styles with a tool like PurgeCSS.
- Caching and compression: Set long cache lifetimes for versioned assets and enable Brotli or Gzip at the server level.
- CDN: Route static assets through a content delivery network so users get files from a server near them, not across an ocean.
- Server response: Keep Time to First Byte (TTFB) low. No amount of frontend work compensates for a slow server.
Table of Contents
- How to measure your website’s current speed accurately
- 12 proven tips to improve website loading speed
- Why Google’s Core Web Vitals matter for your site’s performance
- How to use Google PageSpeed Insights and Cloudflare for ongoing speed gains
- Webspidersolutions handles the technical work so you can focus on growth
- Key Takeaways
How to measure your website’s current speed accurately
Before touching a single file, know which metric you are actually failing. Running a test in Google PageSpeed Insights or Lighthouse without understanding what the numbers mean leads to fixing the wrong things.
Key metrics to track:
- LCP (Largest Contentful Paint): How fast the biggest visible element loads. Target under 2.5 seconds.
- INP (Interaction to Next Paint): How quickly the page responds to a tap or click. Target under 200ms.
- CLS (Cumulative Layout Shift): Visual stability while loading. Target under 0.1.
- TTFB (Time to First Byte): How fast the server starts responding. Target under 800ms.
Tools worth using:
- Google PageSpeed Insights: Combines lab data with real-user field data from the Chrome User Experience Report. Start here.
- Google Lighthouse: Built into Chrome DevTools. Runs a simulated load and gives you a scored audit with specific fixes.
- WebPageTest: Deeper waterfall analysis, filmstrip view, and multi-location testing for diagnosing TTFB and third-party script issues.
- GTmetrix: Combines Lighthouse data with its own waterfall view; useful for tracking scores over time.
The critical distinction is lab data versus field data. Lab tools simulate a load under controlled conditions. Field data reflects real visitors on real devices and real networks. Google ranks on field data, so optimize for that, not just your Lighthouse score.
Pro Tip: Set up a weekly automated test in PageSpeed Insights or a monitoring tool so you catch regressions before they affect rankings. A deploy that adds a large image or a new analytics script can silently tank your LCP overnight.
12 proven tips to improve website loading speed
1. Convert images to WebP or AVIF
Images drive the biggest speed gains at the lowest effort, which is why they come first. WebP files run 25–35% smaller than JPEG or PNG at equivalent quality. AVIF compresses further still, though browser support is slightly lower. Use a <picture> element with AVIF and WebP fallbacks for maximum compatibility. Most CMS platforms like WordPress and Shopify have plugins that handle conversion automatically on upload.

2. Serve responsive image sizes
A phone on a 375px screen should never download a 2,400px hero image. Use the srcset attribute so the browser picks the right file for the screen. Responsive sizing can cut image weight by over 70% on mobile, which directly improves LCP for the majority of your visitors.
3. Lazy-load below-the-fold images
Add loading="lazy" to any image not visible on the initial screen. This defers the fetch until the user scrolls toward it, reducing initial page weight. One hard rule: never lazy-load your hero image or LCP element. That image needs to load as early as possible, not wait for a scroll event.
4. Set explicit width and height on every image
Without width and height attributes, the browser cannot reserve space before an image loads. The result is layout shift as content jumps around, which destroys your CLS score. Setting these two attributes is often the single fastest fix for a poor CLS reading.
5. Eliminate render-blocking CSS and JavaScript
Render-blocking resources prevent the browser from painting anything until they finish downloading and parsing. Inline the critical CSS needed for above-the-fold content directly in the <head>, then load the rest asynchronously. For JavaScript, add defer to scripts that do not need to run during the first paint. Use async only for fully independent scripts like analytics.
6. Strip unused CSS and JavaScript
Most sites ship entire CSS frameworks like Bootstrap or Tailwind but use only a fraction of the styles. Tools like PurgeCSS scan your HTML and remove dead styles, shrinking a 200KB stylesheet to under 10KB in many cases. For JavaScript-heavy apps built with React, Vue, or Angular, code-splitting and dynamic imports load only what the current page needs.
7. Enable Brotli or Gzip compression
Text-based assets compress dramatically before they travel over the wire. Brotli achieves 15–25% better compression than Gzip and is supported by every modern browser and CDN. Enable it at the server level (on Nginx: brotli on;) or let your CDN handle it. Verify it is working by checking response headers for Content-Encoding: br.
8. Set up browser caching with long lifetimes
Browser caching tells returning visitors to reuse files already downloaded instead of fetching them again. For versioned assets like main.abc123.css, set Cache-Control: public, max-age=31536000, immutable (one year). For HTML, use no-cache with an ETag so users always get fresh content. Returning visitors are a large share of traffic on most sites, and caching makes their loads near-instant.
9. Use a CDN for static assets
A content delivery network caches your static files on edge servers near your visitors. A user in Los Angeles gets your images from a West Coast node, not a server in Frankfurt. Cloudflare’s free tier is the easiest starting point, and setup typically takes 15–30 minutes with meaningful latency reductions for international audiences.
10. Improve server response time (TTFB)
A slow TTFB drags down every other metric. If TTFB is above 800ms, fix the server before touching anything on the page. Move off cheap shared hosting to a VPS or managed platform, add full-page caching (Redis-backed object caching on WordPress is standard), and keep your runtime and CMS current. Runtime upgrades regularly deliver real performance gains for free.
11. Defer or lazy-load third-party scripts
Third-party scripts like chat widgets, social embeds, and ad trackers are common hidden causes of slowdowns. A single poorly optimized third-party script can add 300–500ms to your load. Load chat widgets only after the page is interactive, using a 3-second setTimeout or an IntersectionObserver. For YouTube or Vimeo embeds, use a facade placeholder that loads the actual embed only on click.
12. Reduce redirects and fix redirect chains
Each redirect adds a round trip to the server, sometimes adding whole seconds on mobile. Redirect chains (A redirects to B, which redirects to C) compound the problem fast. Audit your site periodically and update internal links to point directly to the final destination URL.
Pro Tip: Never lazy-load your LCP image. It is the single most common mistake that tanks Largest Contentful Paint scores. Use loading="eager" or simply omit the attribute entirely for your hero image, and add a <link rel="preload"> tag in the <head> to start fetching it as early as possible.
Why Google’s Core Web Vitals matter for your site’s performance
Core Web Vitals are three specific metrics Google uses to measure real-world user experience, and passing all three is required to get the Page Experience ranking boost. The thresholds are: LCP under 2.5 seconds, INP under 200ms, and CLS under 0.1.
Each metric maps to a distinct user frustration. A slow LCP means visitors stare at a blank or partial screen. A high CLS means content jumps around as they try to read or click. A poor INP means the page feels frozen when they tap a button. Fixing these is not about chasing a score. It is about removing friction that causes visitors to leave.
Google has confirmed Core Web Vitals as ranking signals. Content relevance and backlinks still carry more weight, but speed acts as a tiebreaker. Between two comparable pages, the faster one tends to win. Speed also lifts rankings indirectly by reducing bounce rates and increasing time on page, both of which signal engagement to Google’s algorithms. Tracking these metrics through website performance metrics over time gives you the clearest picture of where to focus next.
How to use Google PageSpeed Insights and Cloudflare for ongoing speed gains
These two tools cover different parts of the problem. PageSpeed Insights diagnoses what is wrong. Cloudflare fixes a large portion of it at the infrastructure level.
Using Google PageSpeed Insights:
- Go to PageSpeed Insights and enter your URL.
- Review the Field Data section first. This reflects real users, not a simulation.
- Check which Core Web Vitals are failing and read the Diagnostics section for specific causes.
- Prioritize fixes by the “Estimated Savings” column. A fix that saves 2 seconds of LCP beats one that saves 50ms.
- Retest after each change to confirm the improvement registered in field data (allow a few days for the Chrome User Experience Report to update).
Setting up Cloudflare for speed:
- Create a free Cloudflare account and add your domain.
- Update your domain’s nameservers to Cloudflare’s (your registrar’s DNS settings).
- Cloudflare automatically enables CDN, HTTP/2, and Brotli compression once active.
- In the Speed tab, turn on Auto Minify for HTML, CSS, and JavaScript.
- Enable caching rules for static assets under the Caching tab.
Cloudflare’s free tier enables CDN, HTTP/2, HTTP/3, Brotli compression, and caching in a single setup. The combination reduces TTFB and cuts load time for visitors anywhere in the world. For most small and mid-size sites, this one step delivers more improvement than weeks of manual code optimization.
Pro Tip: After connecting Cloudflare, run a PageSpeed Insights test from a location far from your origin server (use WebPageTest’s location selector). The TTFB improvement is most visible for geographically distant users, and that data helps you make the case for CDN investment internally.
Webspidersolutions handles the technical work so you can focus on growth
Getting a fast site requires more than running a PageSpeed Insights report. It means correctly prioritizing fixes, implementing them without breaking anything, and monitoring performance as your site evolves. That is where Webspidersolutions comes in.
Webspidersolutions offers technical SEO and site performance optimization as part of a full digital marketing service, covering everything from Core Web Vitals remediation to CDN setup, image pipeline optimization, and ongoing monitoring. You get the expertise of a dedicated team without hiring in-house engineers or managing the work yourself.
If your site is losing rankings or conversions because of slow load times, Webspidersolutions can audit your current performance, identify the highest-impact fixes, and implement them. Visit webspidersolutions.com to request a free SEO audit and see exactly where your site stands.
Key Takeaways
Website speed improvement delivers the fastest results when you fix images first, then JavaScript and CSS, then server and caching infrastructure.
| Point | Details |
|---|---|
| Images drive the biggest gains | Images typically account for a large proportion of page weight; convert to WebP/AVIF and serve responsive sizes first. |
| Core Web Vitals are ranking signals | LCP under 2.5s, INP under 200ms, and CLS under 0.1 are Google’s “good” thresholds for the Page Experience boost. |
| Cloudflare setup is fast | Cloudflare’s free tier enables CDN, Brotli compression, and HTTP/2 with a quick setup time. |
| Field data beats lab scores | Google ranks on real-user field data from the Chrome User Experience Report, not simulated Lighthouse scores. |
| Webspidersolutions | Offers technical SEO and performance optimization audits to identify and fix speed issues without in-house engineering. |