


TL;DR:
- Campaign performance measurement involves using KPIs and analytics to determine if marketing efforts achieve business goals. Most teams focus on activity tracking rather than causation, risking wasted budgets and stagnating growth. Using accurate methods like incrementality testing and aligning KPIs with goals improves decision-making and marketing effectiveness.
Measuring campaign performance is the process of quantifying how effectively marketing activities achieve defined business objectives using data-driven metrics and analysis. Most marketers track activity. Far fewer track causation. The gap between those two approaches is where budgets get wasted and growth stalls. This guide covers how to select the right KPIs, use the right tools, interpret results accurately, and avoid the measurement mistakes that mislead even experienced teams.
What KPIs should you use to measure campaign success?
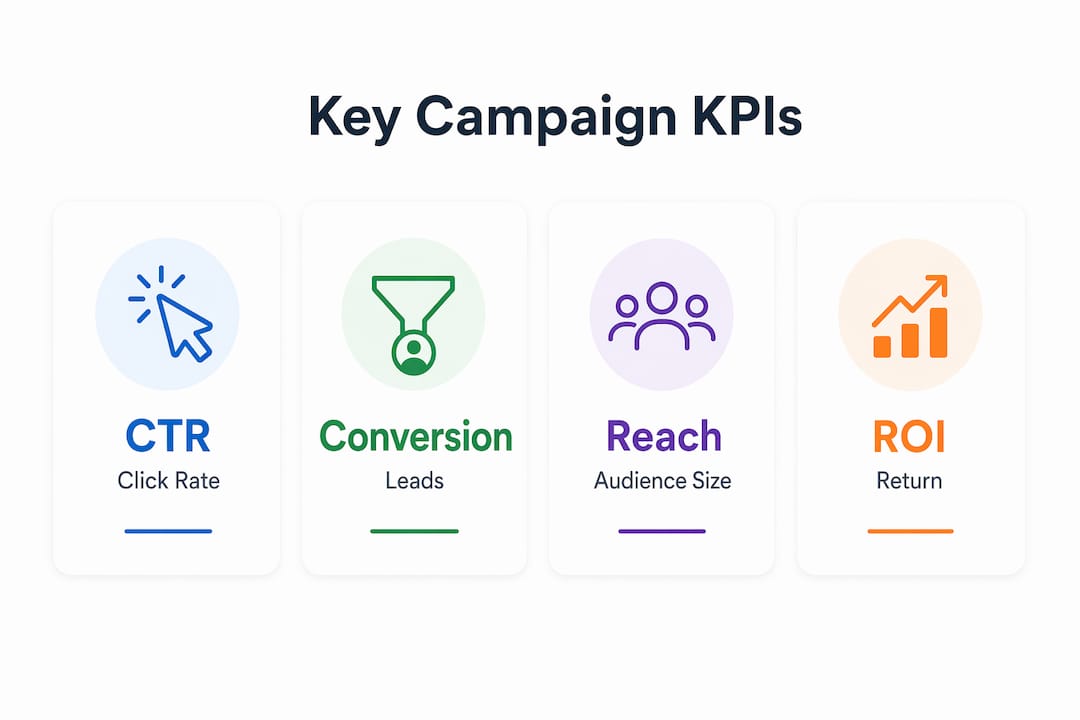
KPIs are only useful when they connect directly to a campaign goal. A brand awareness campaign needs reach and interaction metrics. A lead generation campaign needs conversion rate and customer acquisition cost (CAC). Mixing these up produces data that looks good but tells you nothing useful.
The most common performance metrics for campaigns fall into three categories: awareness, pipeline, and commercial outcome. For ABM campaigns, awareness KPI benchmarks are: Reached above 70%, Visited around 40%, and Interacted between 25–30%. These numbers give you a concrete threshold to judge whether a campaign is working or needs adjustment.
| KPI | Formula | Best use case | Benchmark |
|---|---|---|---|
| CTR (click-through rate) | Clicks / Impressions | Paid ads, email | 0.05–0.07% (ABM display) |
| Conversion rate | Conversions / Visitors | Lead gen, e-commerce | Varies by channel |
| CAC (customer acquisition cost) | Total spend / New customers | Acquisition campaigns | Lower than LTV |
| ROI | (Revenue – Cost) / Cost | All campaign types | Positive and growing |
| Pageview lift | Lift % vs. control group | ABM, display advertising | 25–45% among target accounts |
Aligning KPIs to goals before a campaign launches prevents the common trap of measuring what is easy rather than what matters. Google Analytics, Demandbase, and most paid media platforms let you set conversion goals upfront so reporting stays focused.
Pro Tip: Set SMART objectives before you choose your KPIs. A goal like “increase qualified leads by 20% in Q3” forces you to pick conversion rate and CAC over vanity metrics like impressions.
Which tools and methods can effectively measure campaign performance?
The right measurement tool depends on your campaign type, data volume, and how deep you need to go. Google Analytics remains the standard for web-based campaign tracking. It handles traffic attribution, goal completions, and audience behavior at scale. Demandbase Advertising analytics adds account-level data for B2B teams running ABM campaigns, showing which target accounts are engaging and at what depth.

Attribution models are built into most platforms, but they have a fundamental flaw. Attribution models assign credit but can misrepresent causation. Knowing that a display ad received the last click before a conversion does not prove the ad caused the conversion. Reallocating budget based on that assumption leads to poor decisions.
| Tool / Method | Strength | Limitation |
|---|---|---|
| Google Analytics | Web traffic, goal tracking, free | Limited cross-channel view |
| Demandbase | Account-level ABM measurement | B2B focused, higher cost |
| Last-click attribution | Simple, widely supported | Ignores upper-funnel impact |
| Multi-touch attribution | More complete journey view | Still correlation, not causation |
| Incrementality testing | Measures true causal lift | Requires control group setup |
Incrementality testing is the most rigorous method available. Exposed/control group measurement reveals the true campaign effect, free from attribution bias. You show ads to one group and withhold them from a matched control group, then compare outcomes. The difference is the real lift your campaign produced.
Multi-layered reporting also matters. Structure your reports in three layers: activity (what you did), performance (what happened), and commercial outcome (what it meant for revenue). Most teams stop at layer two. Layer three is where the business case lives. For paid media campaigns, this three-layer structure separates teams that prove value from teams that just report numbers.
How to analyze and interpret campaign performance data accurately?
Data without context is noise. A high CTR sounds good until you realize it came from a low-intent audience that never converted. A low CTR looks bad until you see it came from a high-position page driving qualified traffic.
CTR should always be analyzed against position. A lower-position page with a higher CTR can outperform a high-position page with a low CTR in real business terms. Position tells you where you appear. CTR tells you whether your message resonates. Revenue tells you whether any of it mattered.
Common interpretation mistakes to avoid:
- Treating correlation as causation. A spike in conversions after a campaign launch does not prove the campaign caused it. Seasonality, PR, or a competitor’s outage could explain the same result.
- Ignoring pageview lift as a signal. For ABM display campaigns, a pageview lift below 25% among targeted accounts signals a problem with targeting or creative quality.
- Reporting ROI without accounting for all costs. CAC calculations that exclude agency fees, tool subscriptions, and internal labor overstate efficiency.
- Focusing on vanity metrics. Impressions and follower counts feel good in a report. They rarely connect to revenue.
- Skipping qualitative data. Customer interviews and sales team feedback explain the “why” behind the numbers.
Pro Tip: Combine quantitative data with qualitative feedback from your sales team every month. They hear objections and buying signals that no dashboard captures.
Lift metrics add another layer of accuracy. Measuring branded search volume before and after a campaign shows whether the campaign built real awareness. For email marketing campaigns, open rate trends over time reveal whether your audience is growing more or less engaged, which no single campaign metric can show alone.
What are common challenges and best practices in measuring campaign effectiveness?
Measurement breaks down in predictable ways. Knowing the failure patterns in advance lets you build systems that avoid them.
The biggest challenge right now is attribution complexity in AI-driven marketing. 58% of organizations report attribution complexity as a major barrier to measuring AI marketing effectiveness. AI tools cross multiple touchpoints simultaneously, making it nearly impossible to assign credit accurately with traditional models.
A second challenge is hidden cost blindness. AI marketing operations carry hidden costs that most measurement frameworks miss, including Martech stack complexity and data management overhead. A campaign that shows strong conversion numbers may be losing money once you account for the full operational cost of running it.
Best practices that address these challenges directly:
- Shift from activity tracking to value engineering. Measure economic outcomes, not just campaign outputs. Ask what revenue or pipeline each activity produced.
- Use incrementality testing for major campaigns. Set up exposed and control groups before launch, not after. Retrofitting a control group produces unreliable results.
- Account for all costs in ROI calculations. Include tool costs, agency fees, and internal time. Partial cost accounting inflates ROI and leads to bad budget decisions.
- Set a measurement cadence and stick to it. For CTV and display campaigns, weekly reporting covers delivery, biweekly reporting covers outcomes, and monthly reporting covers brand metrics. Mixing cadences produces inconsistent data.
- Treat signal loss as a design constraint. As AI and LLM-powered search grow, traditional site visitation signals erode. Build measurement systems that do not depend entirely on cookie-based tracking.
The teams that measure well share one habit: they define what success looks like before a campaign starts, not after the results come in. Retroactive success definitions are how vanity metrics survive.
Key takeaways
Accurate campaign measurement requires goal-aligned KPIs, causal analysis, and full cost accounting. Teams that stop at activity metrics miss the business impact their campaigns actually produce.
| Point | Details |
|---|---|
| Align KPIs to campaign goals | Choose awareness, pipeline, or revenue metrics based on what the campaign is designed to achieve. |
| Use incrementality testing | Exposed/control group designs reveal true causal lift that attribution models cannot show. |
| Report in three layers | Structure reports as activity, performance, and commercial outcome to connect campaigns to revenue. |
| Account for all costs | Include tool, agency, and labor costs in ROI calculations to avoid inflated efficiency numbers. |
| Set a measurement cadence | Use weekly delivery checks, biweekly outcome reviews, and monthly brand metric reports. |
Why most measurement frameworks are built to comfort, not inform
The uncomfortable truth I have learned working across digital campaigns is that most measurement frameworks are designed to make marketers feel good, not to tell the truth. Dashboards fill up with green arrows. Reports show rising impressions and improving CTR. Meanwhile, the business is not growing.
The shift that changes everything is moving from tracking what happened to proving what you caused. That requires incrementality thinking, honest cost accounting, and the willingness to report a campaign as a failure when the data says so. Most teams are not set up to do that because the incentives run the other way.
The AI measurement crisis makes this more urgent. Marketing leaders must transition from activity tracking to value engineering to prove AI marketing’s true economic impact. That is not a technology problem. It is a culture problem. The tools exist. The willingness to use them honestly is what is missing.
My practical advice: pick one campaign this quarter and measure it properly. Set up a control group. Account for every cost. Report the real lift. That single exercise will teach you more about your marketing than a year of standard reporting. Once you see the gap between attributed results and real results, you cannot unsee it. That gap is where better decisions live.
The teams winning on AI-driven marketing are not the ones with the most data. They are the ones asking better questions of the data they already have.
— webspider
How Webspidersolutions can help you measure and grow
Webspidersolutions works with marketing teams and business owners who need more than a dashboard. The agency builds SEO campaigns grounded in commercial outcome reporting, not just traffic numbers. From PPC and paid media to content and technical SEO, every service is tied to measurable business results. If your current measurement framework is producing green arrows but flat revenue, Webspidersolutions can audit your analytics setup, identify where attribution is misleading your decisions, and build a reporting structure that connects marketing spend to real growth. Request a free consultation to see where your measurement gaps are costing you.
FAQ
What is measuring campaign performance?
Measuring campaign performance is the process of tracking and analyzing marketing activities against defined business objectives using KPIs, attribution models, and analytics tools. The goal is to determine whether a campaign produced real business value, not just activity.
Which KPIs matter most for evaluating campaign success?
The most important KPIs depend on your campaign goal. Awareness campaigns prioritize reach and interaction rates, while acquisition campaigns focus on conversion rate, CAC, and ROI.
What is incrementality testing in marketing?
Incrementality testing compares outcomes between an exposed group that saw your ads and a control group that did not. The difference between the two groups shows the true causal lift your campaign produced, separate from organic trends.
How often should you review campaign performance data?
Weekly reporting works for delivery metrics, biweekly for outcome metrics, and monthly for brand-level metrics. Mixing these cadences produces inconsistent data that is hard to act on.
Why do attribution models give misleading results?
Attribution models assign credit to touchpoints but cannot prove causation. A touchpoint that receives credit for a conversion may not have influenced the decision at all, which leads to misallocated budgets when taken at face value.